vol. 5 5/2016 Inżynier i Fizyk Medyczny
276
artykuł
\
article
radioterapia
\
radiotherapy
Bad Pixel Map correction can be carried out using XVI software
correction tools or manually using the XIS application (the application
allows to preview “raw” images). Each of the “offset” or “flood’’ image
can be analyzed individually in relation to occurrence of uncorrected
pixels in the clinical or test images. Defect pixels in the BP images can
be “overwritten” by pre-defined values. That procedure is not effec-
tive when the neighboring bad pixel lines or clusters of bad pixels are
in the active matrix. This is due to the correction algorithm takes the
average value of neighboring pixels to overwrite bad pixels. When de-
fect pixels are neighboring then that correction is destructed. When
the bad pixel lines (clusters) are at the edge of the active matrix this
may affect the image quality and cause a central bright artefact in 3D
images (themost visible in the LFOV images) (see Fig. 7). The bad rows
of pixels can to be extracted from the reconstruction (sri.ini file). The
uniformity test has to be done afterward to balance the image quality.
The Bad Pixel procedure should be also run in a regular way to ob-
serve a trend of panel degradation during an use. Additionally it can
be used to verify a new panel/refurbished panel after replacement
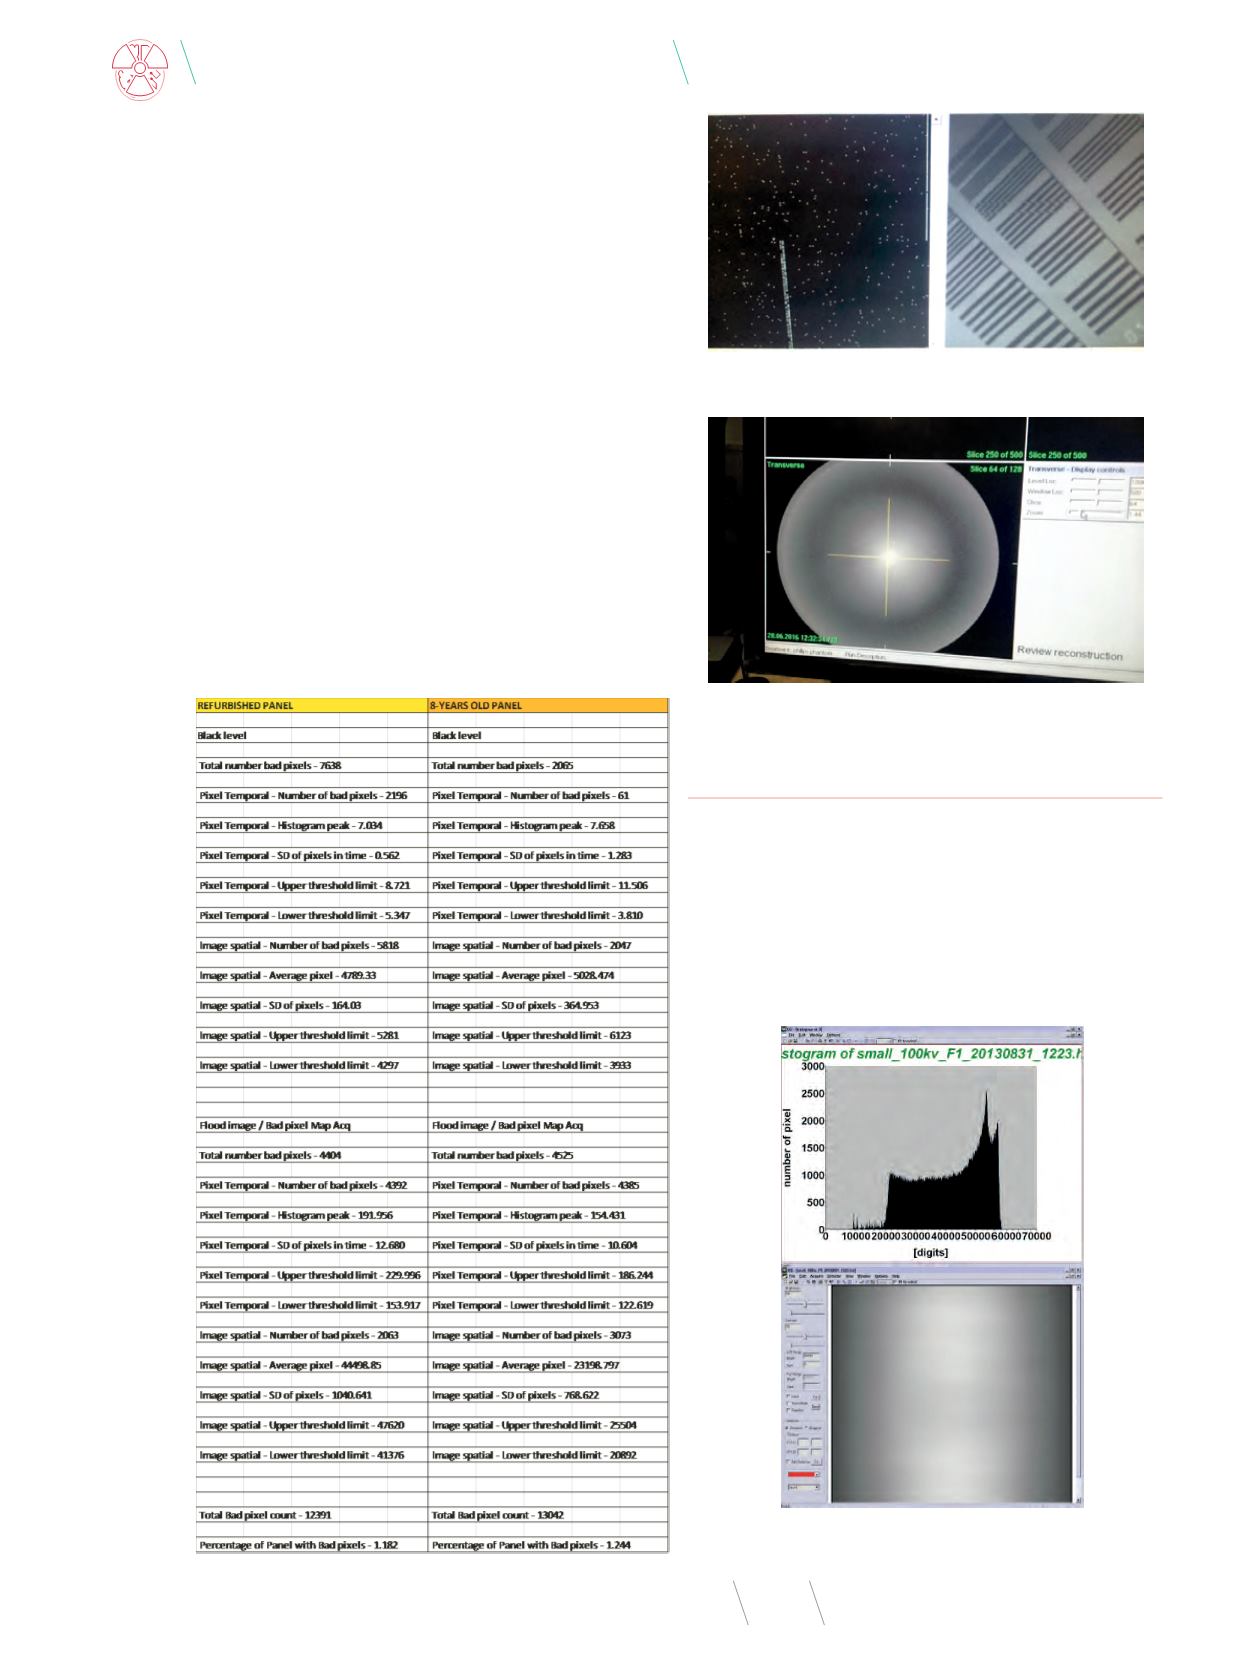
of it as well as to set baselines (Fig. 4) – see Tab. 1.
Tab. 1
. Statistic – comparison between the 8 years old panel and the refurbished
panel after replacement
Fig. 6
. Not corrected bad pixel lines in the TOR FG18 image – horizontal lines
Source: Own results.
Fig. 7
. Centrally settled artefact caused by “cutting” from reconstruction 40 rows
of edge pixels (LFOV)
Source: Own results.
GAINS
Gain calibration is an operation that compensates for pixel-to-pix-
el variations in x-ray sensitivity of the system. That variation can be
caused by non-uniformity in the active matrix, that results in varia-
tion in TFT characteristic, variation in the thickness of the x-ray de-
tector material and gain non-uniformity between different charge
amplifier channels. This variation necessitates image correction
through post-processing.
Fig. 8
. Histogram without saturated pixels and Saturation-free image
Source: [3].


