Inżynier i Fizyk Medyczny 5/2016 vol. 5
275
artykuł
/
article
radioterapia
/
radiotherapy
reklama
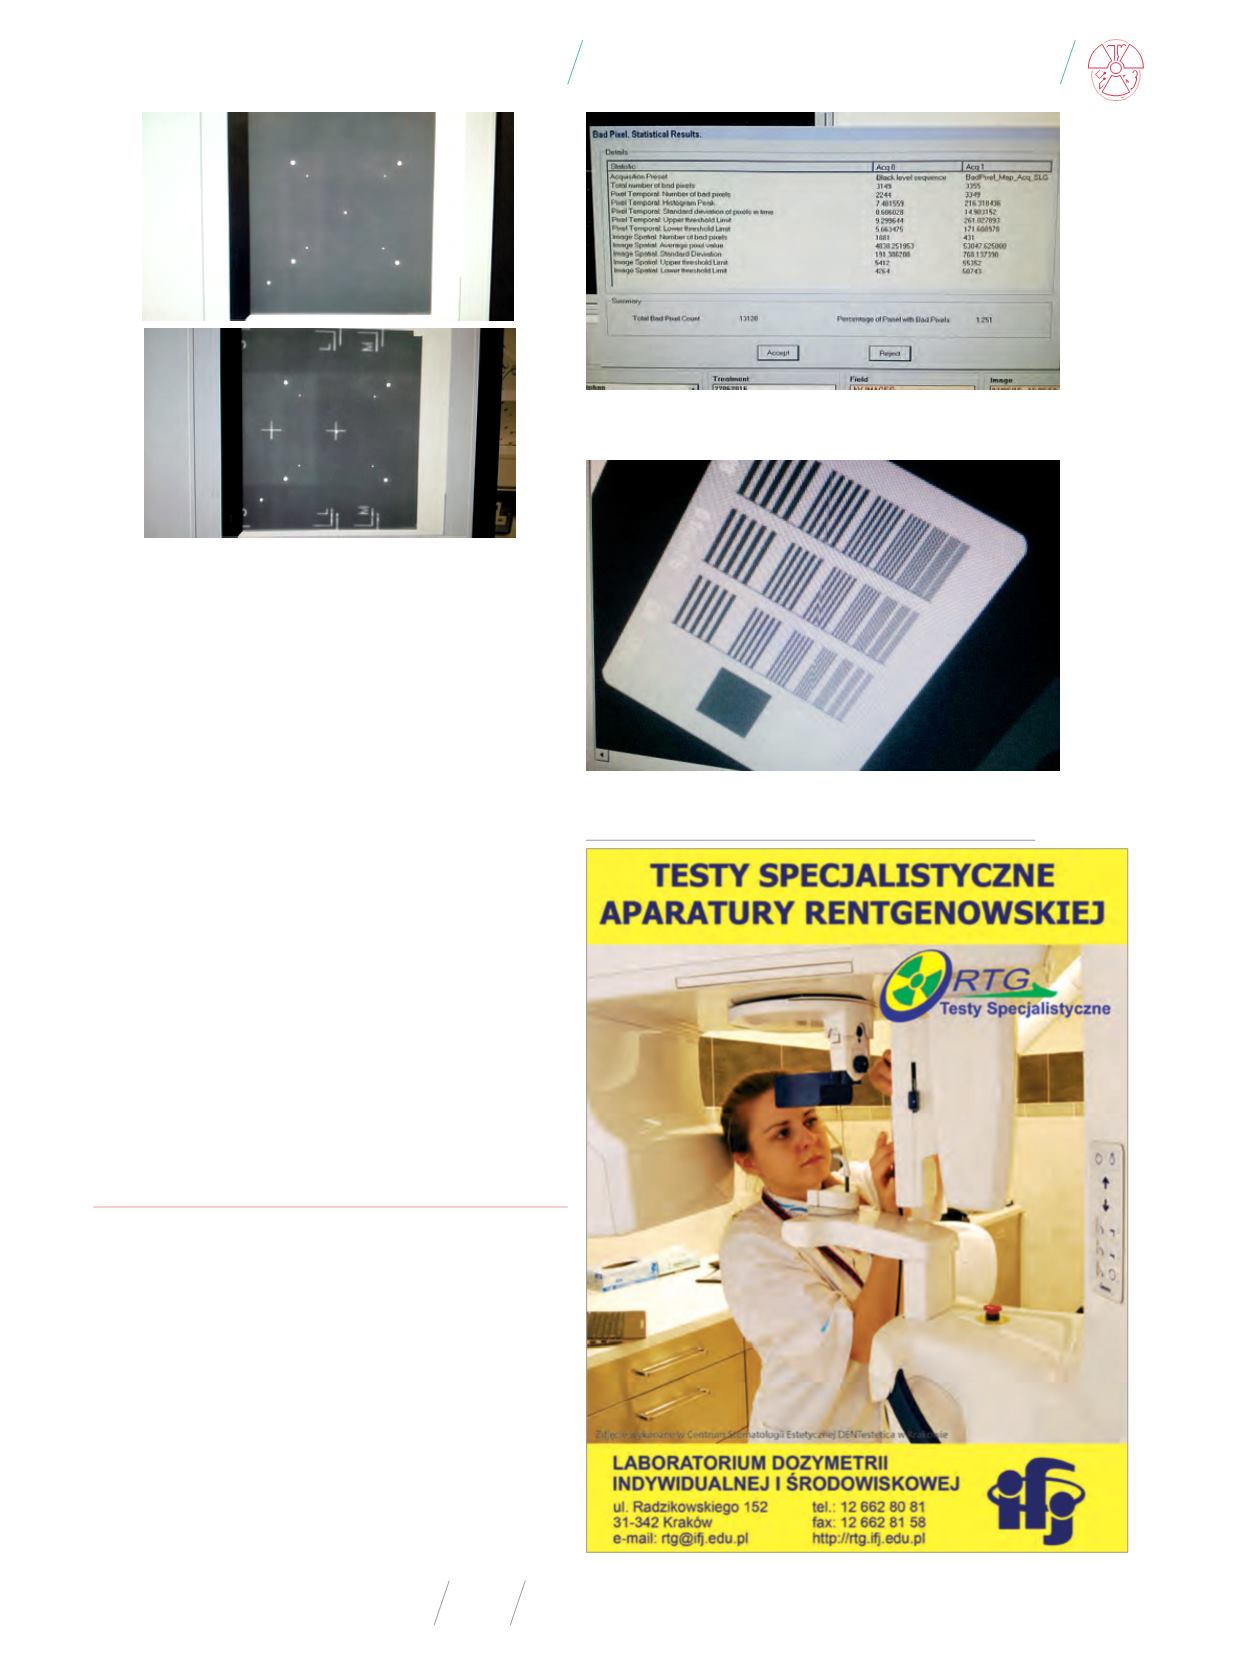
Panel alignment can be verified using the projection of a CAL1 fil-
ter. It is based on evaluation of the markers positions (central cross-
es and corner markers) in relation to the pixel coordinates for each
FOV (Fig. 3). For example SFOV, the central cross coordinates should
be x=512 pixels and y=512 pixels (+/-10 pixles) and corner markers
symmetrical from the edges of the active matrix. That method can
verified a beam axis position in relation to the panel coordinates. It
is not sensitive enough to assess beam alignment. Then the method
of projection of two point objects can be used to verify this. Those
objects are placed at a distance of about 35.0 cm from each other
(Fig. 18). That method is characterized by a geometrical resolution
better than 0.08 deg (desired 0.50 deg).
In addition, that test object allows to verify alignment of an im-
aging panel surface (i.e. a deflection resulting from e.g. a gravity
effect). That can be done by assessing the distance of the markers
located symmetrically off-axis (Fig. 3) in the corners. The results
showed the panel deflection of 0.20 deg in the transverse direction,
0.40 deg in the longitudinal and 0.70/0.20 deg in the diagonal direc-
tions. It can affect the reconstruction in terms of the geometrical as
well image quality parameters.
BAD PIXEL CORRECTION
Defect pixels are unavoidable during manufacturing of the active
matrix of the imaging panel. Those pixels can be identified by set-
ting a lower threshold of X-ray sensitivity based on the pixel statistic.
That result is stored into the bad pixel map correction. After getting
gain calibration, the bad pixels should be replaced by the average
values of neighboring good pixels. That correction algorithm for
a XVI system is based on the average values of neighboring pixels.
It might result that not corrected bad pixels lines and not correct-
ed single bad pixels can be detected in the test images (a spatial
frequency pattern of a TOR FG 18 phantom). They are visible as an
inversion (“zig-zag” artifact) in the images of the spatial frequency
patterns (Fig. 5, 6).
Fig. 4
. Bad pixel map statistics
Source: Own results.
Fig. 5
. Not corrected bad pixel lines in the TOR FG18 image – vertical lines
Source: Own results.
Fig. 3
. Panel alignment and beam alignment test images
Source: Own results.


